


Graphics in SYBYL
The graphical user interface consists of a molecular drawing window, a command/message window, a set of graphics widgets, and a set of pull-down menus:
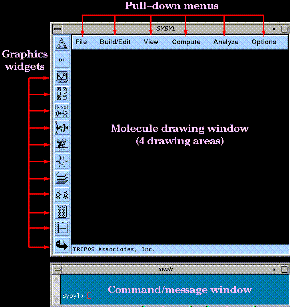
It is important to note that virtually all commands available in the graphical interface can be typed into the command/message window prompt or used in a SYBYL SPL script. Unfortunately, the syntax of the keyboard and graphical interface commands is considerably different.
The molecule description for each structure in SYBYL's molecule areas is used for molecular graphics operations. This information is "mapped" into each of the four drawing areas of the molecule drawing window:
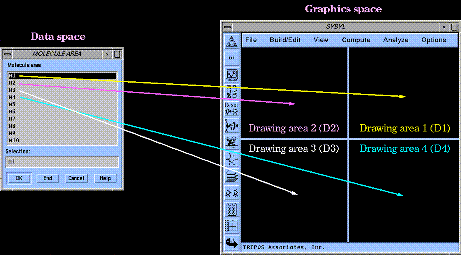
The mapping process is done roundrobin until all structures in the molecule areas are drawn (e.g. M1-M4 are mapped to drawing areas 1-4, M5 is then mapped to area 1, M6 to area 2, and so on).
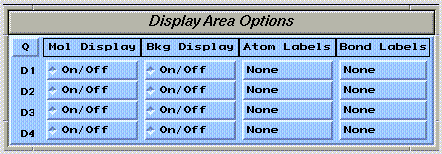
The visibility of molecule drawings can be selectively controlled using the  widget:
Graphical Representations
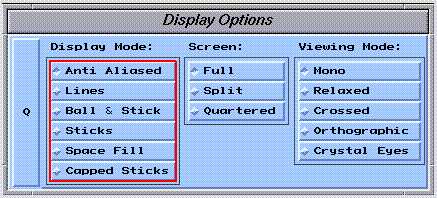
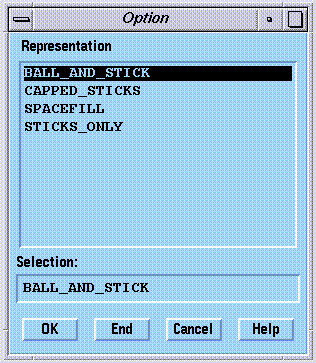
A number of graphical representations are available in SYBYL. The most frequently used representations are selected using the  widget:
Bonds Only
The default representation, "Antialiased", is best for general viewing. Graphics performance using the "Lines" representation may be better on lower end graphics workstations.
"Stick" and "Capped Stick" representations are fancy wire drawings.
Atoms
"Ball & Stick" and "Space Fill" use spherical atom representations. These drawing styles are fancy, and can severely reduce graphics performance for large molecules.
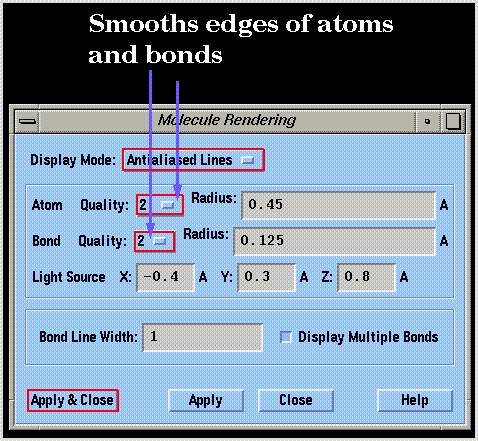
Graphics performance can be improved by reducing the resolution of the drawings using the "Rendering Options..." command of the "View" menu:
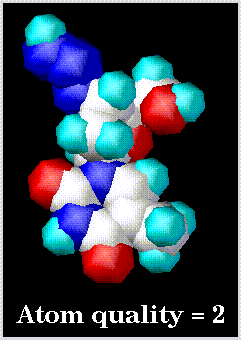
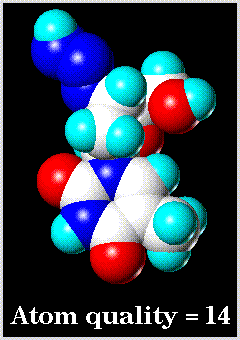
Examples of low and high resolution space-filling drawings are as follows:
Other graphical representations are generated using menu commands. These include:
Mixed Representations
Mixtures of ball-stick, capped stick, and space-fill representations in the same or different structures. Note that ribbons, dot surfaces, and solid surfaces can be drawn individually and displayed simultaneously with any of the other drawing styles.
- "Mixed Rendering..." command of the "View" menu.
Human oxyhemoglobin is shown with the heme groups in ball-stick and residue 11 (sickle cell mutation site) in space filling representation. The ribbon drawing was made in a separate step using the "Display" command of the "Biopolymer" menu.

Dot surfaces
- van der Waals.
- "Dot Surfaces - vdW Dot Surface..." command of the "View" menu.
- Solvent accessible.
- "Dot Surfaces - Connolly Surface..." command of the "View" menu.
Solid surfaces
Solid surfaces can be drawn in opaque or transparent form. The "Contour Surfaces - Surface Style..." command is set to "Opaque" or "Transparent".
- Electrostatic contours.
- "Contour Surfaces - Isopotential Contour..." command of the "View" menu.
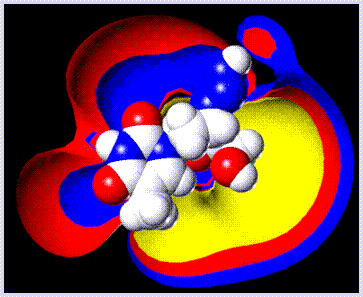
- van der Waals envelope.
- "Contour Surfaces - Volume Contour..." command of the "View" menu.
- Solvent accessible envelope.
- "Shaded Surfaces" command of the "View" menu.
- Multiple molecule volume comparison envelope (e.g. common volume).
- "Contour Surfaces - Multiple Volume Contour..." command of the "View" menu (note that molecules must be properly superimposed prior to using this command).
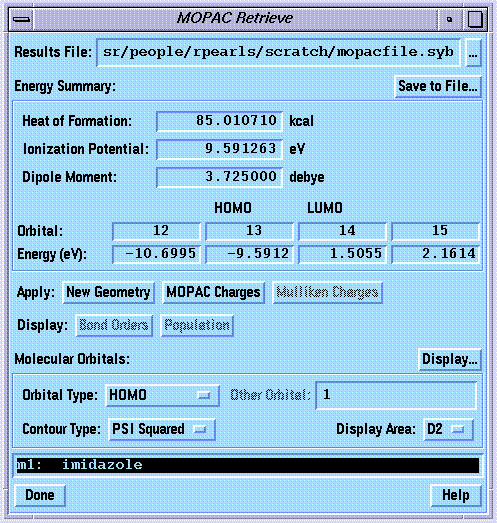
- Molecular orbital contours.
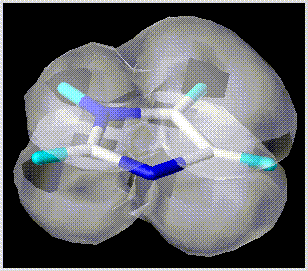
- "Interfaces - MOPAC..." command of the "Analyze" menu (note that a MOPAC calculation must first be performed using the "Interfaces - MOPAC..." command of the "Compute" menu).
Mesh surfaces
Mesh surfaces are drawn as for solid surfaces, except the "Contour Surfaces - Surface Style..." command is set to "Standard".
- Electrostatic contours.
- van der Waals envelope.
- Solvent accessible envelope.
- Multiple molecule volume comparison envelope (e.g. common volume).
- Molecular orbital contours.
Biopolymer representations
Biopolymer representations are drawn using the "Display" command of the "Biopolymer" menu.
- Alpha carbon trace (proteins and peptides).
- "C Alpha Only..." sub-command.
- Simple flat ribbon drawn with lines.
- "Line Ribbon..." sub-command.
- Flat shaded ribbon.
- "Shaded Ribbon..." sub-command.
- Thick (tubular cross section) shaded ribbon.
- Thick (tubular cross section) shaded ribbon with arrows embedded in beta strands (proteins and peptides).
- "Ribbon/Tube..." sub-command.
Graphical Transformations
Rotations and Translations
Rotation and translation about the X, Y, and Z axes (graphical transformations), and scaling can be performed by moving the mouse while depressing various combinations of mousekeys. Alternatively, the  widget can be used:
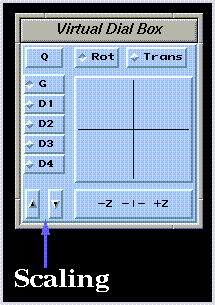
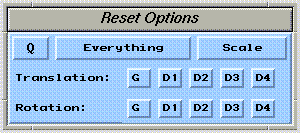
Graphical transformations can be applied simultaneously to all structures in all drawing areas (G), all structures in a single drawing area (D1, D2, D3, or D4), or to a single structure in any drawing area (OBJ).
You can toggle through these selections using the drawing area selector  widget. The label on this widget corresponds to the currently selected drawing area. The "OBJ" mode is activated by clicking on the desired molecular structure while holding down the "Ctrl" key on the keyboard. This mode is deactivated by clicking in an empty region of the drawing window while holding down the "Ctrl" key. Note that scaling transformations apply uniformly to all structure drawings.
Graphical transformations can be undone using the  widget:
It is extremely important to note that graphical transformations apply only to molecule drawing(s) and not to the corresponding molecule description(s). The molecule description of a given structure drawing can only be updated using the "Freeze View" command of the "View" menu:
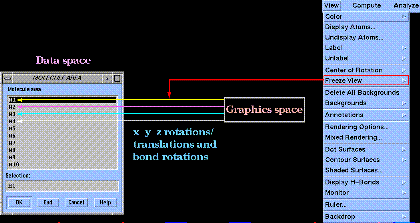
Graphical transformations (other than scaling) cannot be undone using the  widget after "Freeze View".
Bond Rotations
Bond rotations are performed using the  widget:
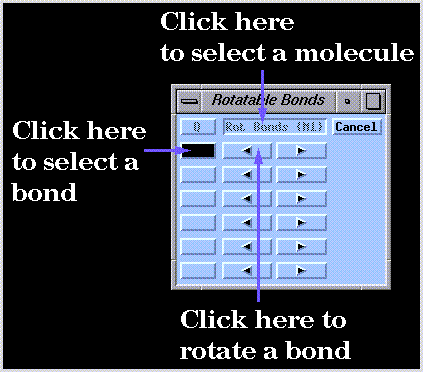
Bonds are "connected" to the rotation controls by first clicking on the control panel button shown in the previous illustration followed by a pair of bonded atoms in the molecule drawing. Bonds in different structures (e.g. M1 and M2) can be included in the same control panel using the "Rot. Bonds" button.
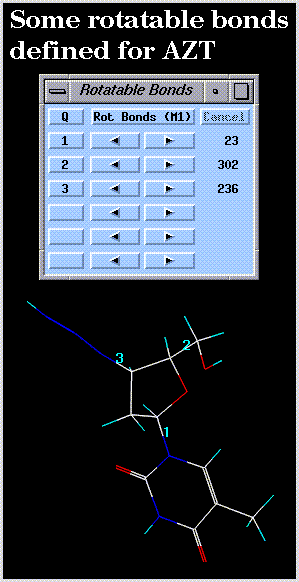
The arrow buttons are then used to rotate bonds clockwise or counterclockwise. The anchor atom can be specified using the "Rot. Bonds" button. Note that bond rotations are not undone by the  widget. Use the arrow buttons of the bond rotation control panel to reset any desired bond rotations to zero.
An initialized bond rotation control panel is illustrated below:
Visualization Aides
Clipping
The clipping slab width and position can be adjusted using the  widget:
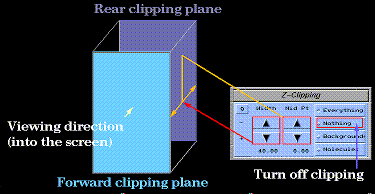
Depth Cueing
Depth cueing can be adjusted using the  widget:

Depth cueing in SYBYL is not particularly useful, and should generally be turned off by sliding the control bar to 0.
Graphical Output
Graphical output from SYBYL can be created using the "Plot" command - "Screen..." sub-command of the "File" menu or using the external image capturing tools described elsewhere. You can select "Postscript" or "Color Postscript" from the "Plotter Type" pull-down menu. Note that the PostScript output is considerably different from the screen representation: solid surfaces are drawn in wire mesh form, ribbons in line form, and ball-stick or space-filling representations are drawn using an unsophisticated shading technique. You will need to print the PostScript file outside of SYBYL.


 widget:
 widget:


 widget can be used:
 widget. The label on this widget corresponds to the currently selected drawing area. The "OBJ" mode is activated by clicking on the desired molecular structure while holding down the "Ctrl" key on the keyboard. This mode is deactivated by clicking in an empty region of the drawing window while holding down the "Ctrl" key. Note that scaling transformations apply uniformly to all structure drawings.
 widget:
 widget after "Freeze View".
 widget:
 widget. Use the arrow buttons of the bond rotation control panel to reset any desired bond rotations to zero.
 widget:
 widget: