


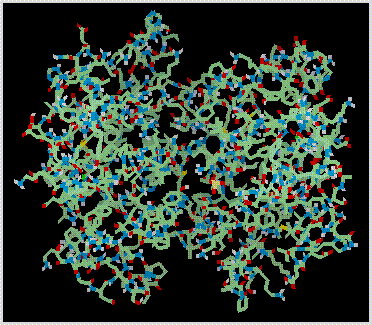
In the simplest case, single lines are drawn for bonds. The line thickness, use of depth cueing and antialiasing can enhance or detract from these drawings, depending on the size of the molecule and the program. A line drawing of hemoglobin produced by QUANTA is shown with and without antialiasing:
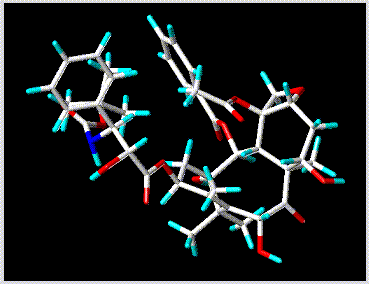
Bonds can also be represented as shaded rods or tubes (referred to as "stick" in SYBYL and "licorice" in QUANTA):
Representations of Molecular Structure
Bonds Only
Molecular structures are commonly drawn in the form of lines representing bonds. These drawings may be referred to in different molecular graphics programs as line, stick, Dreiding, or wire-frame.
SYBYL and Insight II draw two or three parallel lines for double and triple bonds respectively, and dashed lines for partial double bonds. QUANTA does so only after processing molecules through the "Molecular Editor."
Atoms
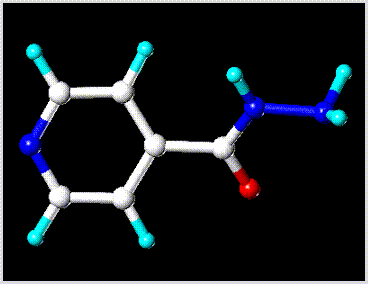
Atoms are typically represented as spheres of characteristic size (e.g. van der Waals radii) in space-filling (CPK):

Ribbons
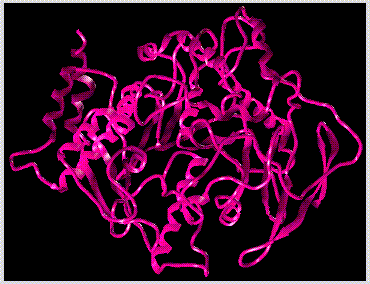
Ribbons are used to represent protein and DNA backbone structures. The simplest ribbon drawing consists of a set of parallel curves. More sophisticated ribbons can be drawn as solid objects, complete with shading and highlighting (QUANTA, SYBYL, MolScript, Raster3D, Ribbons). Other styles include shaded, highlighted tubes of round (SYBYL, QUANTA, Insight II, MolScript) or square (Insight II) cross section. A ribbon drawn by SYBYL is shown below:
MolScript/Raster3D and Ribbons produce the fanciest publication quality ribbon drawings of the programs discussed in this document.
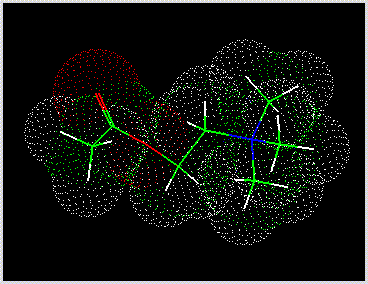
The physical boundary of a molecule is one such property. This can be represented in the form of a van der Waals surface, which is based on spherical atoms scaled according to their van der Waals radii. The van der Waals dot surface of acetylcholine, as drawn by Insight II is shown below:

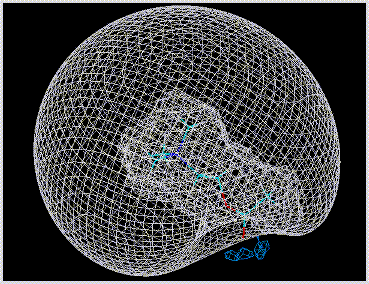
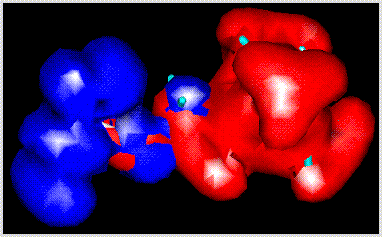
Properties described by analytical functions or numerical data can be graphically represented in the form of contour plots. Two-dimensional (level curves) or three-dimensional contours (level surfaces) can be drawn at constant values of the function. The value(s) at which the function is contoured can be specified. Concentric contour surfaces (e.g. representing different levels of potential) can be viewed by drawing in wire-mesh form or using clipping.
One such property is the electrostatic potential associated with the distribution of charge over the atoms of a molecule. Wire-mesh electrostatic contours drawn by Insight II for acetylcholine are shown as follows:
Mixtures of Graphical Representations
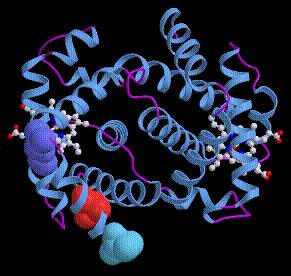
Mixtures of ribbons, space-filling, line, ball-stick, and surfaces in the same drawing can be performed by SYBYL, QUANTA, Insight II, and Molscript/Raster3D. In the following drawing produced by MolScript/Raster3D, the side chains of three hemoglobin mutations are highlighted using a space-filling representation. The heme groups are drawn in ball-stick and the backbone in ribbon form:
Ideally, transformations should keep pace with interactive instructions (e.g. movement of the mouse), and should appear smooth and continuous. In practice, interactive graphics performance is best for simple line drawings (e.g. stick structures; wire-mesh and dot surfaces), and deterioriates with drawing sophistication (even on some of the fastest graphics workstations). Highlighting, shading, and other effects used in conjunction with solid drawings contribute to the aesthetics of molecular graphics, but at the cost of drawing speed. Molecular graphics programs often provide optional tradeoffs between interactivity and drawing quality. Common shortcuts include the use of lower order polygons or dots to represent surfaces or spheres in space-filling and ball-stick drawings, less sophisticated shading techniques, and elimination of hidden surface removal.
The choice of representation should be matched to the size of the molecule and to the intended purpose of the drawing. Interactive work is best performed using a stick drawing, especially for large molecules because the pictures are the least crowded and graphic performance is optimum. Space-filling, van der Waals, and other surfaces are best drawn for large molecules using dot or wire-mesh representations. Fancy drawings that cannot be effectively manipulated interactively should be reserved for creating publication quality drawings.
Depth Cueing and Perspective
Depth cueing is intended to enhance the three-dimensional appearance of molecular graphics, particularly stick representations. Depth cueing is performed by applying a brightness gradient to a drawing, such that the atoms (usually bonds) become progressively dimmer along the Z direction (into the screen). While this effect can be useful for interactively viewing biopolymers, it can make small molecules appear excessively dim, and can detract from the clarity of printed pictures. QUANTA has a useful implementation of depth cueing, although it cannot be deactivated when necessary. Depth cueing can (and probably should) be deactivated in SYBYL and Insight II.
Perspective is another approach used for three-dimensional appearance enhancement. Perspective is based on the principle that objects appear to diminish in size with viewing distance. This is performed by applying a size gradient to a drawing, such that the atoms (usually bonds) become progressively smaller along the Z direction.
Stereo
Stereographic processing can greatly enhance the three-dimensional appearance of molecular graphics images. Stereographic display requires two drawings of a graphical object (stereo pairs), that are slightly rotated in space (i.e. 3 degrees or so) relative to each other. The left eye is allowed to see only the first image and the right eye the second image (eye-restricted viewing). The brain "fuses" the two images together to create an illusion of three-dimensionality.
All of the methods for generating stereo effects differ primarily in the approach used to create eye-restricted viewing of a stereo pair. The simplest method (side-by-side) draws adjacent images separated by a user-adjustable distance. Simple devices (stereo viewers) can be used to restrict each eye to its own image. Many people find side-by-side stereo difficult, especially when the images are far from the viewer. Furthermore, some people see a cross-eyed view of the stereo pair in which the right eye sees the left image and vice versa. This can result in a problem for chiral molecules, in which the incorrect enantiomer is perceived.
Greater viewing convenience is possible when the left and right eye images are drawn superimposed. Eye-restricted viewing of superimposed stereo pairs can be performed in various ways:
Clipping
Clipping is mainly used to visualize the interiors of macromolecules and solid surfaces (e.g. electrostatic contours). Clipping is performed by "cutting" a graphically displayed molecule in a plane parallel to the screen (i.e. perpendicular to the Z-axis). The atoms in front of the clipping plane are temporarily hidden so as not to obscure the atoms behind the clipping plane. As a molecule is rotated, the positions of the atoms change in relation to the clipping plane, allowing the interior to be seen from different vantage points.
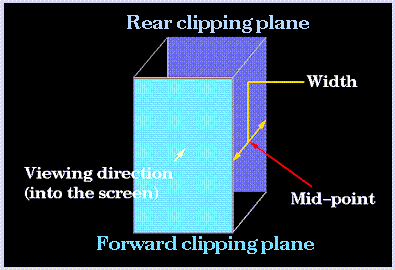
Fancier clipping is performed using forward and rear clipping planes (a slab). Atoms lying either in front of or behind the boundaries of the slab are hidden. The width of the slab (along the Z-axis) can be modified to include larger or fewer numbers of atoms. The slab can also be translated along the Z-axis, allowing the depth of the cut to be adjusted. The boundaries of the actual slab are invisible, but are highlighted in the following drawing for the purpose of this dicussion:
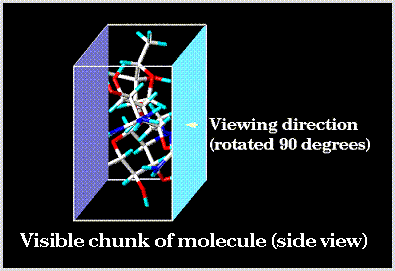
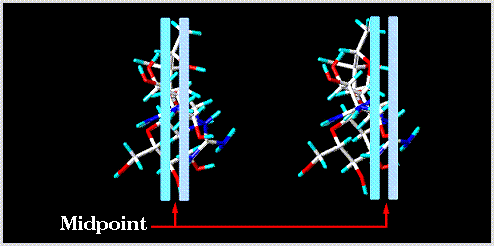
The effect of changing the width of the slab (for a given position) is as follows (viewed at a 90 degree angle relative to the screen):

Clipping can also be used to visualize the interiors of solid surface drawings. The interior of a surface may contain a molecular structure drawing or even other surfaces (e.g. different contour levels of electrostatic potential):
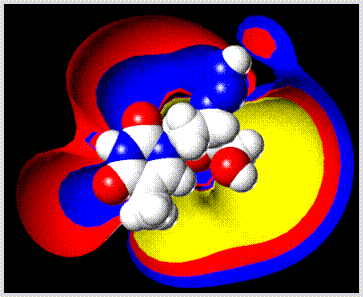
Alternative methods of visualizing the interior regions of proteins include alpha-carbon, backbone-only, and ribbon representations. Stereographic display can also be used to help visualize detailed three-dimensional structures. Surfaces can be drawn in dot form (dot surfaces) rather than solid form, which has less of an obscuring effect on the molecular structure. Transparent solid surfaces can be drawn by SYBYL.
Color
Color coding can be used to differentiate atom or monomer types in a biopolymer, as well as to highlight particular atoms (e.g. those that define a pharmacophore) or particular monomers (e.g. residues in the active site of an enzyme).
Color can be used for aesthetic purposes to create the illusion of three-dimensionality of solid objects (e.g. CPK drawings and solid surfaces) via shading, highlighting, and texturing.
Labels
Labels are used to identify the components of a molecular structure drawing (e.g. atoms, monomers, and other collections of atoms), to view data associated with each atom (e.g. atom type, partial atomic charge), and to view geometric measurements associated with particular sets of atoms (e.g. bond angles).
Labeling can be done selectively or an entire molecule can be labeled at once. Labeling all of the atoms of a large molecule can result in illegible information. The identity of a particular atom can be obtained in QUANTA and Insight II by clicking on it with the mouse. SYBYL requires selecting the desired atom(s) using the "Label" command.